Project
GPUFleet
Deterministic discrete-event simulator for GPU scheduling tradeoff analysis.
Python Discrete-Event Simulation GPU Scheduling ML Infrastructure
Analyzes how scheduler policy changes cost, latency, fairness, utilization, and placement efficiency under mixed ML workloads. Compares FIFO, Bin Packing, Cost-Aware, and Priority policies against the same workload and records every scheduling pass as a structured decision trace.
Built as a formal exploration of GPU scheduling tradeoffs in AI infrastructure, informed by prior work reducing a projected $6.5M AWS trajectory to $1.5M. Read the case study →
The problem
GPU schedulers rarely fail outright. They degrade into higher queue times, stranded capacity, and unfairness under mixed workloads. Those failure modes are hard to reason about from aggregate metrics alone.
GPUFleet provides a controlled environment to compare scheduler policies against the same workload, inspect the placements they considered, and see exactly why a cluster became efficient, fragmented, or unfair.
Approach
A discrete-event simulation engine processes job arrivals, scheduling decisions, and completions using a min-heap event queue. The engine jumps between meaningful events rather than iterating through empty time, keeping complexity proportional to actual system activity.
Four pluggable scheduler strategies compete on the same synthetic workload. Each produces a full decision trace (JSONL) recording every scheduling pass: what jobs were pending, what placements were feasible, and what the scheduler chose and why.
- FIFO
- Submission-order baseline with first-fit placement. Predictable, but blind to fragmentation and cost.
- Bin Packing
- Sorts larger jobs first and packs onto fuller nodes to preserve future placement feasibility.
- Cost-Aware
- Chooses the lowest-cost feasible placement among candidates. Most useful when price variance is meaningful.
- Priority
- Favors urgent jobs over fairness. Improves responsiveness for critical work while increasing starvation risk.
Results
Showcase scenario: 64 GPUs (8 nodes, mixed A100 + H100), 150 jobs with Poisson arrivals, 50% same-node placement requirement.
| Metric | FIFO | Bin Packing | Cost-Aware | Priority |
|---|---|---|---|---|
| GPU Utilization | 91.7% | 86.3% | 90.3% | 92.7% |
| Total Cost | $1,991 | $2,003 | $1,994 | $1,983 |
| Mean Latency | 6,206s | 7,466s | 6,302s | 6,083s |
| p95 Latency | 17,391s | 18,822s | 17,504s | 18,159s |
| Fairness (Jain) | 0.537 | 0.622 | 0.543 | 0.491 |
| Makespan | 23,505s | 24,955s | 23,855s | 23,229s |
No policy won outright. Priority improved responsiveness and produced the shortest makespan, but had the worst fairness. Bin Packing preserved larger placements and reduced fragmentation pressure, but increased latency. Cost-Aware showed limited separation in this scenario because placement constraints dominated cost variance.
Key findings
Fragmentation dominated cost policy in this scenario.
Cost varied by only ~1% across schedulers ($1,983 to $2,003), while utilization moved by 6.4 percentage points and fairness varied materially (0.491 to 0.622). Under heavy same-node constraints, placement feasibility mattered more than cost optimization. Cost-aware scheduling matters more when placement is easy and price variance is large enough to influence feasible choices.
High utilization does not imply efficient scheduling.
The cluster reported >90% utilization while simultaneously exhibiting stranded capacity. GPUs were busy, but unusable for waiting jobs due to fragmentation. Utilization alone is a misleading health metric.
Scheduler policy changes the shape of the tradeoff, not the existence of one.
In this scenario, workload shape and same-node constraints mattered more than cost policy. Cost, makespan, and utilization fell in a narrow range across all four schedulers, while fairness and queue latency diverged. Broader claims would require parameter sweeps across arrival rate, placement pressure, and GPU price variance.
Priority improves responsiveness at the cost of starvation.
Priority had the lowest mean latency (6,083s) but the worst Jain fairness index (0.491). Low-priority jobs accumulated severe queue times. This mirrors a common pattern in systems like Kubernetes and Slurm: priority improves responsiveness for urgent work but can starve lower-tier workloads under contention.
Utilization over time
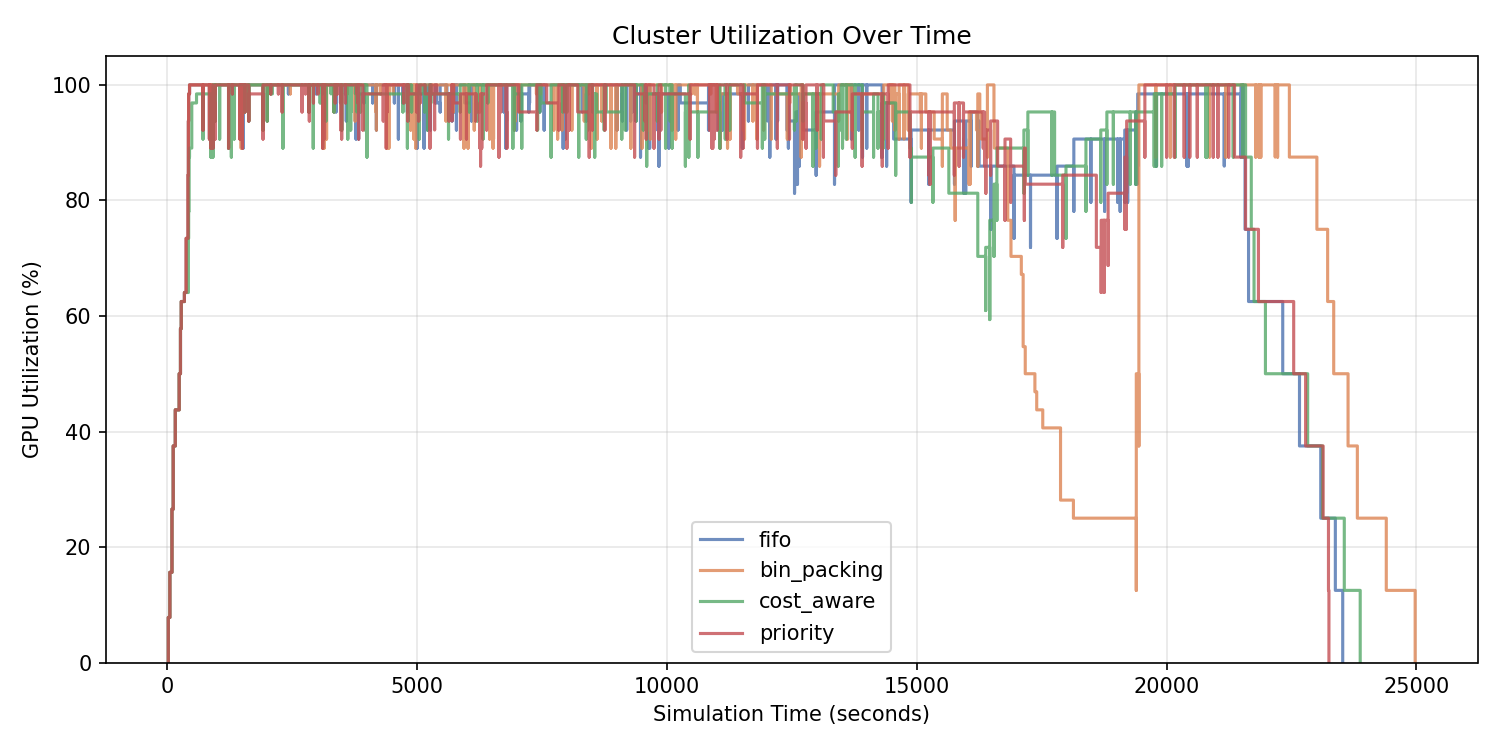
Priority and FIFO keep the cluster busier for longer, but the utilization chart alone hides fairness and fragmentation effects. Higher sustained utilization does not automatically imply better scheduling outcomes.
Latency distribution
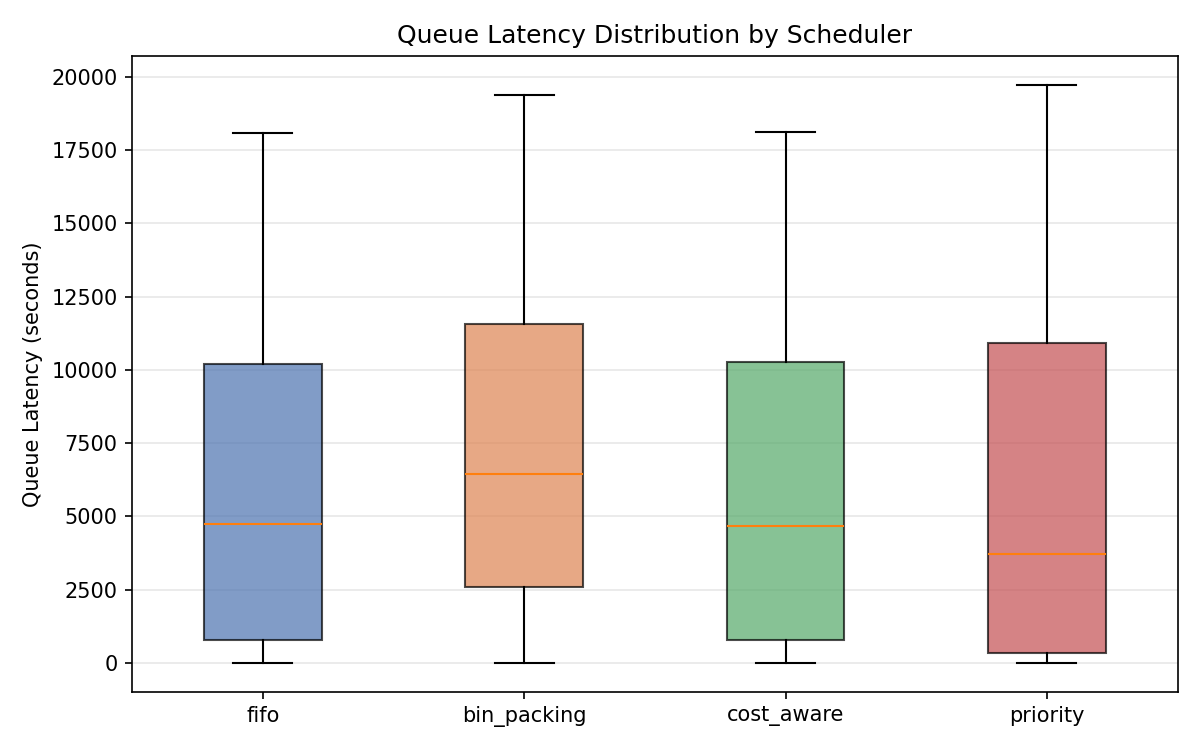
Priority lowers median latency but creates the worst fairness score, showing how responsiveness for urgent jobs can come at the cost of starvation for lower-priority work.
Why FIFO stalls despite free GPUs
Every scheduling pass is recorded as a JSONL record. This makes it possible to answer questions like "why did FIFO fragment here?" with concrete evidence rather than intuition.
FIFO at t=12,399s: 5 GPUs idle, 2 jobs waiting, 0 placed
{
  "schema_version": "1.0",
  "time": 12398.6,
  "scheduler": "fifo",
  "cluster_state": {
    "total_gpus": 64,
    "idle_gpus": 5,
    "idle_gpus_by_node": { "node-5": 1, "node-6": 4 }
  },
  "candidates": [
    {
      "job_id": "job-15",
      "feasible": false,
      "reason": "requires 8 GPUs with >=40.0GB; only 5 available"
    },
    {
      "job_id": "job-25",
      "feasible": false,
      "reason": "requires 8 GPUs with >=40.0GB; only 5 available"
    }
  ],
  "decisions": []
}
Idle capacity was present, but not schedulable. The waiting jobs required 8-GPU same-node placements, and the free GPUs were fragmented across nodes. In constrained GPU clusters, nominal free capacity and feasible placement are not the same thing.
Outputs
comparison.json— stable metrics contract for cross-scheduler comparisondecision_trace_{scheduler}.jsonl— per-pass decision records for debugging and analysisreport.md— generated markdown summary- PNG charts — utilization, queue depth, latency, and cost
Stack
Python 3.10+ · heapq-based discrete-event simulation · matplotlib · PyYAML · stdlib-only simulation core
124 tests, 98% coverage